2D Heat Transfer Visualization
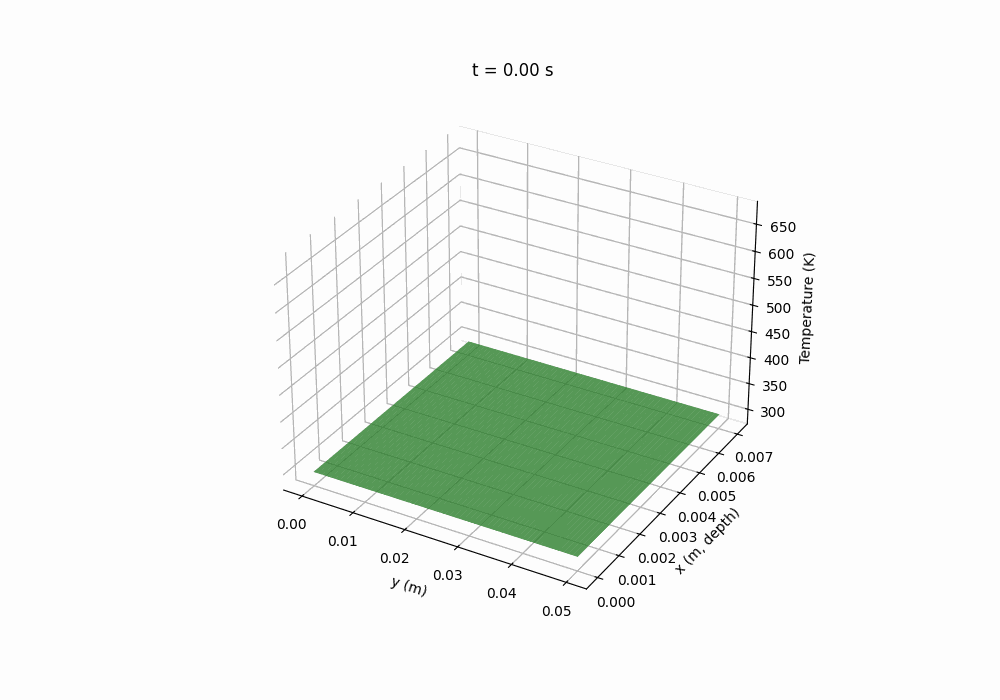
Measured data are used to calibrate key parameters in the PDE model. The full run lasts ~100 s, and ignition occurs near ~90 s under the selected material conditions.
Projects
A representative example of how we turn math & physics into intuitive, visual learning.
Measured data are used to calibrate key parameters in the PDE model. The full run lasts ~100 s, and ignition occurs near ~90 s under the selected material conditions.
Placeholders for upcoming work. We will keep expanding this portfolio.
A step-by-step interactive page that turns derivatives and integrals into visual stories.
A clean simulator-style exploration of RLC transient response, resonance, and damping.
Compact-model intuition pages that connect device physics to practical simulation behavior.